Sales reports and predictions
See what you sold today, this week or this month, compare it with before, export it, and see what's coming.
- For owners
- For managers
On this page
What it's for
Sales shows what your stores sold on a day, in a week (Monday to Sunday) or in a month. Each figure is compared with the period before and with the same period last year. You can break the sales down by product, category, payment method or cashier, and download them for your accountant.
Predictions shows what each store will probably sell next week and next month, and how many days each product's stock will last.
Owners see every store. Managers see the stores they're assigned to.
Before you start
You need:
- to be an owner or a manager
- tills that have synced their sales (a till that's offline sends its sales when it's back online)
Steps
- In the dashboard, choose Sales (under Selling). It opens on today, for the store chosen at the top. Choose All stores there to add every store together.
- Choose Day, Week or Month, and use the arrows to go back or forward.
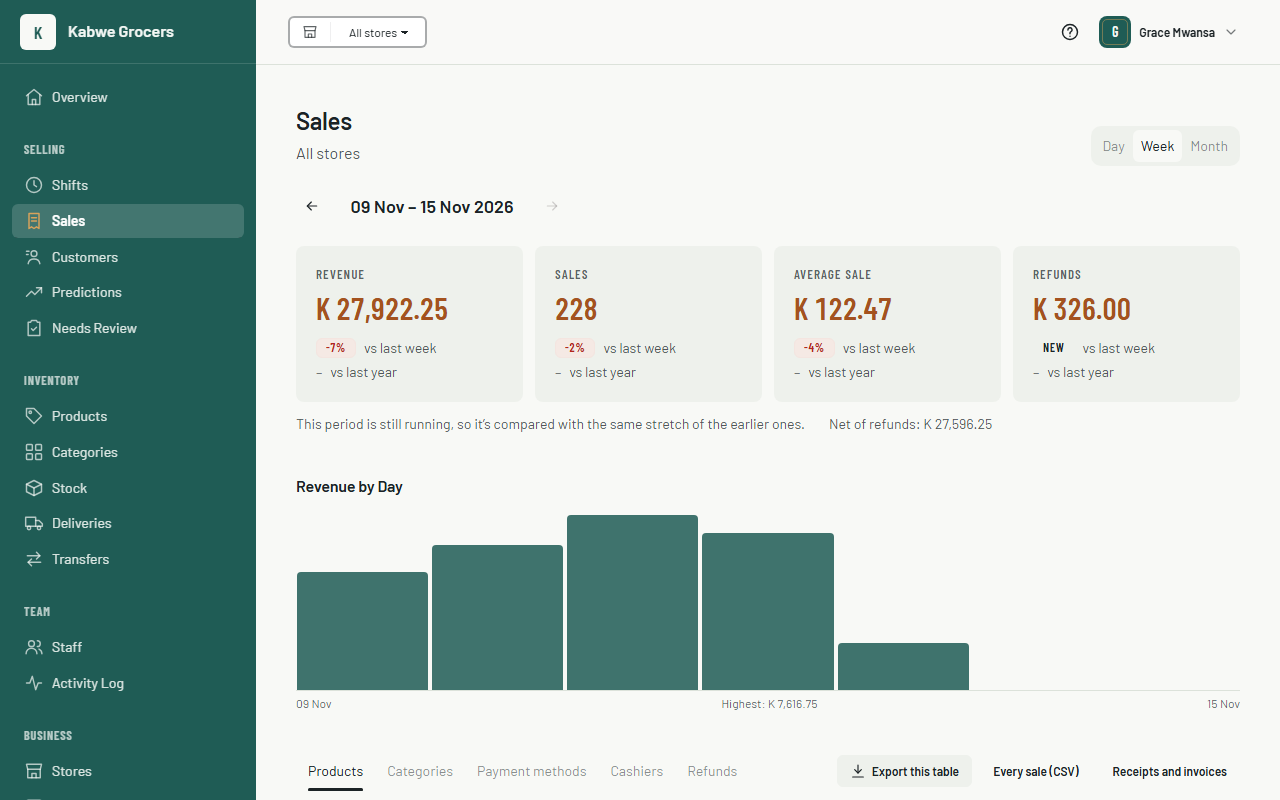
- Read the four figures: Revenue, Sales (how many), Average sale and Refunds. Under each, the first badge compares it with the period before and the second with the same period last year. Green is better and red is worse; for refunds, going up is shown red.
- In a week or month, each bar is one day. Point at a bar to see the amount, or choose it to open that day.
- Below, choose a tab: Products, Categories, Payment methods, Cashiers or Refunds.
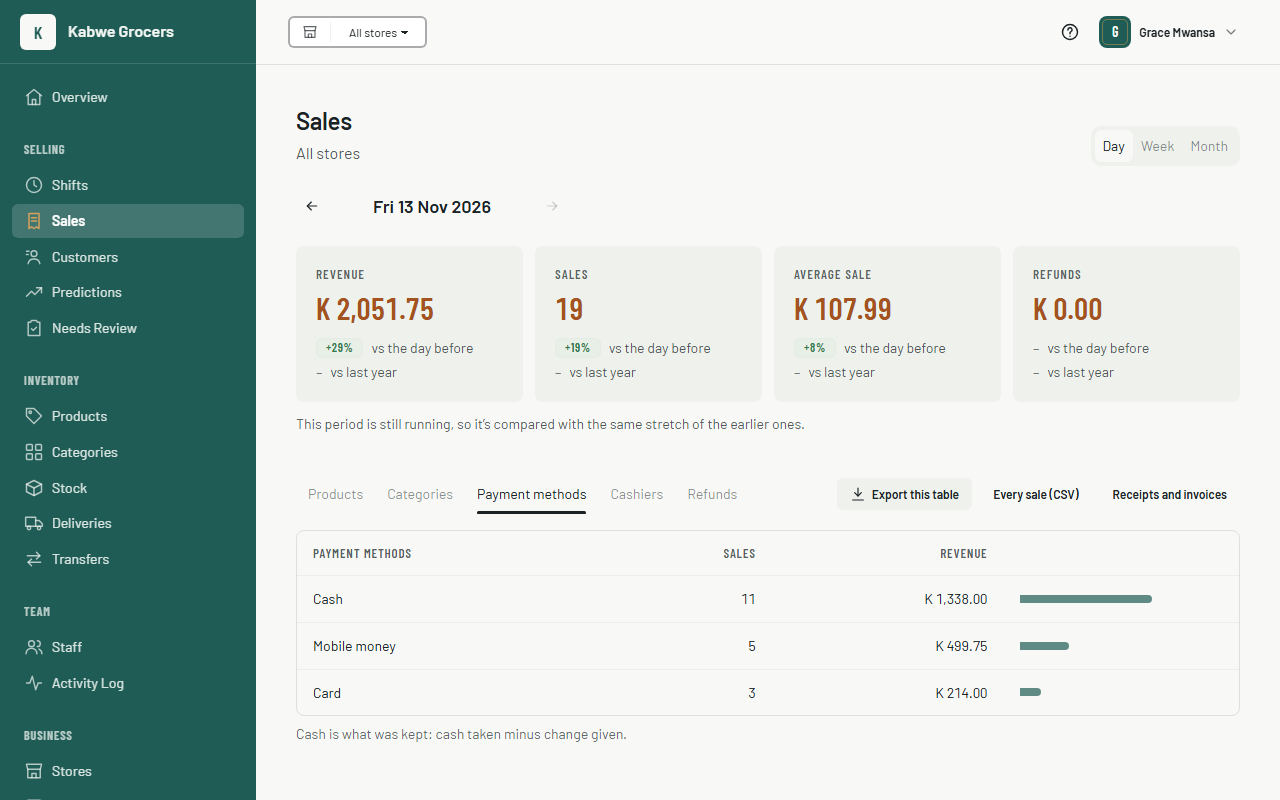
- To download, choose Export this table for the tab you're on, or Every sale (CSV) for one row per receipt. Both open in Excel or Google Sheets.
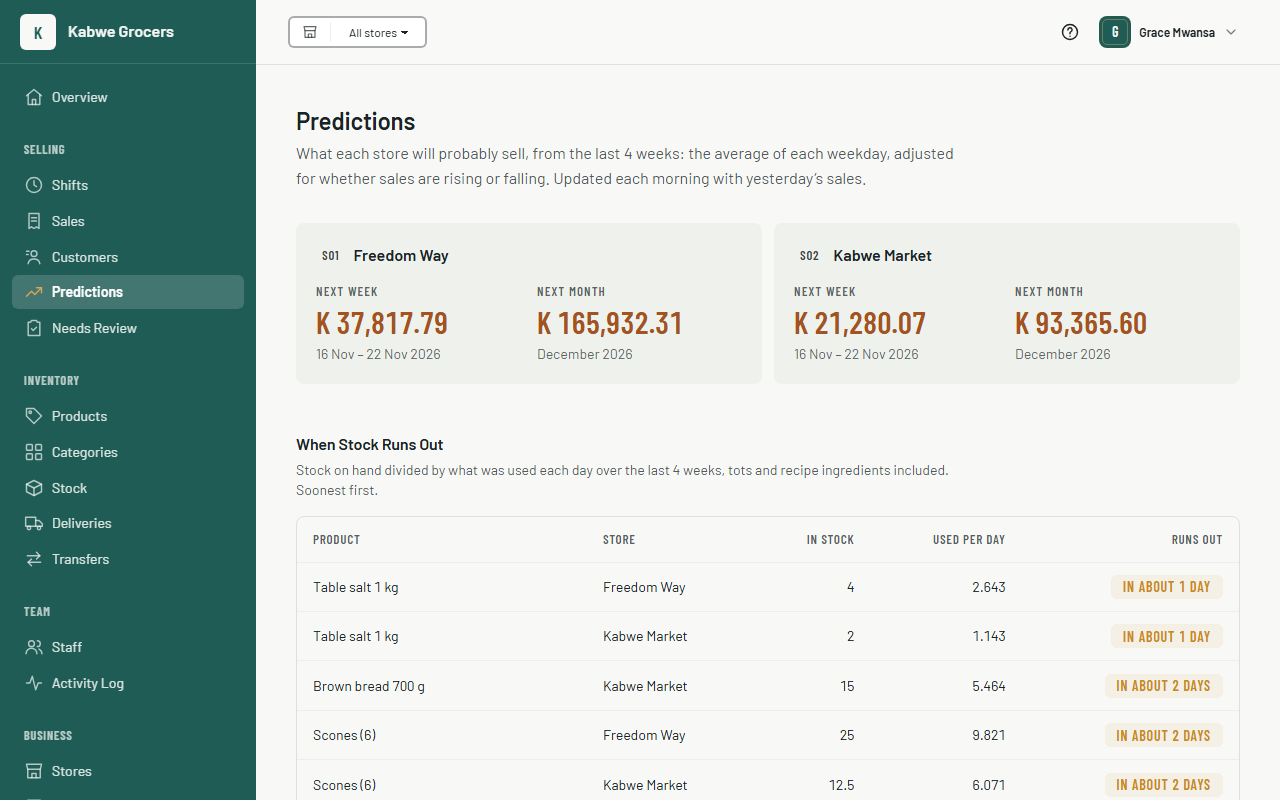
- Choose Predictions (under Selling) to see next week's and next month's expected sales for each store, and the products that will run out soonest.
Common questions
Yesterday's figure went up today. Why?
A till that was offline sent its sales when it came back online. Each sale counts on the day it was rung up, so yesterday's total includes it now.
This week looks much lower than last week.
It isn't, if the week has only just started. While a day, week or month is still running, it's compared with the same stretch of the earlier ones. On Tuesday at 1 pm, this week is compared with last Monday and Tuesday up to 1 pm, and the page says so under the figures.
Does revenue include VAT and discounts?
Revenue is what customers paid: VAT included, after discounts. Refunds are shown separately, on the day they were given, and Net of refunds subtracts them.
Why is cash lower than the cash customers handed over?
Payment methods shows the cash you kept: cash taken minus change given.
A product shows under "Uncategorised".
Sales are grouped by each product's category today. Products without a category, or deleted ones, show as Uncategorised. Give the product a category in Products and the report follows.
Why is there no forecast for my store?
Forecasts start once a store has 4 weeks of sales. Until then the page says Not enough history yet.
How is the forecast worked out?
For each day of the week, it takes the store's average for that weekday over the last 4 weeks. It then adjusts it by the trend: the last 2 weeks against the 2 weeks before, limited to between 20% down and 25% up. It's a guide, not a promise: holidays, paydays and stock-outs change real sales.
How is "runs out in about N days" worked out?
It divides the stock on hand by the amount used each day over the last 4 weeks. Tots and recipe ingredients count, so a bottle sold by the tot still shows when it will run out. Only products with stock tracking that sold in the last 4 weeks are listed.
Some refunds have a "Needs review" badge.
The server flagged them: for example, a refund without a manager's approval, or one for more than was paid. Look into them and mark them checked on Needs review.